
Thanks to the data gathering and cleaning, we were ready to explore the data and find interesting facts. Now we are going to review the most important ones, and show some examples of the the kind of graphs we can explore with the data that was extracted.
Let's not forget the sources of information and dates. More information can be found in the Data Gathering, Data Cleaning and Exploratory Data Analysis Notebooks.
C:\Users\daydr\anaconda3\lib\site-packages\IPython\core\interactiveshell.py:3165: DtypeWarning: Columns (53) have mixed types.Specify dtype option on import or set low_memory=False. has_raised = await self.run_ast_nodes(code_ast.body, cell_name,
The first thing we will review is just the number of games released by year, and the popularity of each game.
Prior to 2014, there were less than 500 games per year released. Starting 2018, it was common to have at least 7500 and now we have even reached 10000 per year. This means around 30-50 games per day.
Let's check the timeline for steam releases and understand what we are seeing right above. (From Wikipedia)

As you can see, 2012 was a big year for Steam. Previously only publishers that made a deal with Steam could publish games, which is why we only see a few (even some of them might have old release dates but in reality were published on Steam later). This is the year Steam Greenlight was born, a process in which Indie Developers could self-publish games on Steam but only if they were "approved by the community". These were very few in between, but kept increasing each year.
On 2017 we see another improvement - More and more games were greenlited and also a lot of publishers made fast deals with steam. But here, any publisher that submitted the necessary data to steam can self-publish any game on steam with no control whatsoever!.
Which is why you can se a lot of releases each month beginning on 2017.
But are these games interesting to analyze? Or do we have much shovelware?
Let's use a different histogram to check how many reviews each game has. The differences are so big that the count will be in logarithmic scale.

With this in mind, let's create a new column:
cat_reviews: 0-10_reviews, 11-50_reviews, 51-500_reviews, 500+_reviews
The game estimation will be simply - Shovelware https://en.wikipedia.org/wiki/Shovelware if it has less than 50 reviews. It might be a bit harsh, but most will be games in this category.
Less than 10 reviews means the game is a big failure, and 51-500 reviews means the game is probable viable but not necessary succesful.

To understand what is happening here let's try putting it into just numbers, and comparing entire years. Let's compare 2021 vs 2016 which was the year before Steam Direct was first introduced.
| 2016 | 2021 | increase | |
|---|---|---|---|
| more_500 | 762 | 857 | 12.467192 |
| 50_500 | 1631 | 1978 | 21.275291 |
| 10_50 | 1250 | 3309 | 164.720000 |
| less_10 | 461 | 5355 | 1061.605206 |
The results are a bit surprising - If we did not know the Steam Direct and Steam Greenlight Phenomena. There are 10 times more shovelware games being released now in Steam than in 2016. Less popular games have also increased by a bit more than double, but really popular games... There are not many more of these.
In reality there could be two causes for this. One is Market saturation : Even though there are more games being released, with the same userbase, the users can only play a limited number of games, and that is why the number of popular games do not really increase.
This is a great idea, but we have a counterpoint for this - The userbase has increased by a lot. Although it is true that we did not check individual reviews, only games with popular reviews. Think on these as checking how many different brands of chocolate are sold on supermarkets - not the individual sales. New users can simply buy the same games / brands than the current users, so there are no new popular products.
Checking this source from statista, you can see that between 2016 and 2021 the number of active users has duplicated. Let's check how the number of total reviews has evolved during the years.
Since we are filtering reviews by the number of reviews linked to the release date of a game, it is probable that years that has games which are clear outliers (CS GO, DOTA2...) alter our plot, so we will only plot data from games with less than 1M reviews.
The other reason is far more simple and we have already talked about it. Steam has moved from being a curated store with individual games being sold in Steam with deals with Valve, to allow certain publishers publish any of their games, then introducing Steam Greenlight to let the users choose new indie games to be published in Steam... and finally, letting anyone to publish games on Steam.
In reality this makes sense - The algorithms on the Steam Store will filter out the unpopular games, so normal users will not feel like the Steam Store has now really bad games - If they do not sell / have reviews they will be filtered out of most searches or views.
In the last years, not very popular games (less than 500 reviews) have only about the 5% of reviews total, despite being 90% of the games on the Store. But it is true that there is now more diversity, before Steam Direct this was much more extreme.
In the exploratory data analysis we also tried to filter the games by its publisher or developer. We would need to curate a list selecting which publishers are AA or AAA studios, so we tried instead to produce this list by filtering the games published or developed with some parameters.
It is true that AA+ studios can consistently put out more successful games than indie studios (overall), but since there are many indie studios, we have a few that also consistently only release very successful games.
At the end we could not differentiate them due to highly successful indie developers, so in the next plots we will not differentiate between AAA+ studios and indie, just by the success (number of reviews) of each game.
The number of reviews for each game have been put into logarithmic scale to be able to see all the points nicely in one graph. The formula we used for the rating gives games without reviews a 50% rating and moves from that point with the absolute rating (positive/total) more with more reviews.
This is to avoid games with very good ratings but very few reviews having better rating than a very succesful games with lots of reviews. It is very similar to the algorithm used in the steam store.
In the next plot, we show the absolute rating instead (without normalizing it) separated by the number of reviews brackets. It is curious to note that the median is 80 but the mode is around 90, for all the categories. Very popular games have less variance and tend to have slightly better scores.
| absolute_rating | ||||||||
|---|---|---|---|---|---|---|---|---|
| count | mean | std | min | 25% | 50% | 75% | max | |
| cat_reviews | ||||||||
| 0-10 | 29458.0 | 38.903800 | 42.486015 | 0.000000 | 0.000000 | 14.285714 | 83.333333 | 100.000000 |
| 11-50 | 15804.0 | 72.940748 | 20.845408 | 0.000000 | 60.000000 | 76.923077 | 90.000000 | 100.000000 |
| 501+ | 7206.0 | 82.093434 | 13.266395 | 11.492516 | 75.874482 | 85.553770 | 91.922379 | 99.876695 |
| 51-500 | 13746.0 | 75.108777 | 17.028428 | 1.960784 | 65.384615 | 78.431373 | 88.528206 | 100.000000 |
Take into account that this is heavy influenced by the existing games and possibly not demand from the customers. Let me make an example. Hades has won 2021 Game of the Year. It is an isometric roguelite centred in Greek Mythology. So tags with that will get an increase in total reviews - but that does not mean necessarily that people are interested in these particular tags. It is safer to assume that with genres, but with themes and moods or other very specific tags it could be wrong to jump to conclusions. Hades could have been an excellent game as well focused in Scifi supernatural or something like that as well.
But in any case, games like that spur interest in the same themes and specially genres, so it is still an interesting point. We will in fact check later influential games.
In general, we see that the total reviews and number of games tend to increase, this is because of what we've seen before. Both competition - and sales are both getting higher each year.
Let's make a few observations from each category.
For top level genres, Simulation, Strategy and RPG sit at a nice balance between total reviews and number of games. Its ratings are also quite average, around 82.
Sports might be an interesting market, we do not have much total reviews but the ratings are unusually low (80 in the average) specially in last years. The issue here is that this is not an indie friendly type of game due to licensing, but still, given how bad reviewed are the last games with official licences, it might be a potential market.
If we look at Genres, Action Rpgs and Shooters have also a good balance of number of reviews vs number of games, without a specially good rating overall. Open World games are also interesting, due to the total number of reviews vs number of games, but they are a bit more difficult to pull off for the indie scene. MOBAs, Battle Royales and MMORPGs have quite low ratings (around 77) while having a low number of games but a lot of reviews. If we look at the more niche genres, basketball, football and soccer (why two tags?) stand out due to the low ratings.
In Sub-Genres, we see that the most popular genre is FPS, and Horror games, with the latter with a lot more competition and lower reviews. More interesting sub-genres are Open World Survivals which are still loved but with not so much games being developed.
If we focus on overall ratings with a nice balance of reviews vs number of games, there might be opportunities with 3rd person shooters, trading games, hero shooter games and immersive sims.
Looking at the sub-genres with fewer games, Looter Shooter, Social Deduction and Party Games do not have much competition with still a noticeable chunk of reviews.
Roguelites and dating sims are curiously very highly rated but they have a lot of competition. However, specially with the latter, we might expect fans of the genre to buy multiple games each year.
We can't assess this category too much, but there are more 2D games than first person, which makes sense as the latter is more difficult to develop. There are too many Anime games, and it is better to market your game as Beautiful or Hand-Drawn than Cute. There are few Isometric Games whilst still having a lot of reviews.
Looking at the more popular tags, Scifi and Survivals have both a lot of reviews and games, but with a nicer balance than Fantasy or "Atmospheric" which have too much games.
In the more niche or specific tags, Zombies is the first one that stands out with a nice balance but pretty average ratings. Then we have Post Apocaliptic, Aliens, Westerns and... Horses? If we try to get tags with worse ratings but nice balance, then Dragons, Futuristic, Military (and derivatives).
One surprising fact for me: Lovecraftian has 90% ratings, while in my opinion there are quite few good games with that theme and a lot of bad ones. This probably is due to the excellent Darkest Dungeon and that a lot of games tag this while having only a touch of "Lovecraftian" Lore.
Games with crafting seem to be more appreciated. PVP is more popular than PVE, with 4 times more reviews while having 2 times more games. However PVE games tend to have lower rating, which is interesting (78 average vs 80). In that sense it makes much more sense to make a Team Based game which tends to perform much better.
Turn based games seem to be not very popular, with still a lot of games being developed for it.
It seems people value more games with Great Soundtrack, Lore Rich or Competitive. Short and Relaxing have very few reviews compared to the number of games.
Multiplayer games get more reviews than games with Single Player. Regarding maturity, it seems focusing your game in nudity rather than violence cuts the number of reviews in half - so that market is less attractive.
Another thing that might be interesting would be to check sub-genres mashups as well as genres or sub-genres vs themes and moods.
That way we might discover discover some interesting niches or combinations.
If you want to check a specific combination (instead of trying to find niches), I suggest checking the exploratory notebook as it has additional plots. Since they contain so much data they are a little hard to read.
In the next plots, each point is a specific combination of tags. If you hover the mouse on top of it you can see which one. in Y we have the number of reviews (sales) and in X the number of games (competitors). The color is the mean rating, which can be interesting as it could be easier to sell more with a combination of tags if the competitors are not well rated (low mean rating).
These plots are almost the same as we observed before with just a single tag, but using combinations.
Let's mention a few examples highlighting some popular combinations that perform well, but I encourage you to explore the plots on your own. I Have only plotted a few of them, but you can explore it further if you want using the notebook and changing the tags. There are a lot of combinations and it's really interesting to focus on the real niches, were we have less than 100 games and see how they performed:
Few games but many reviews:
Many games and few reviews:
In the Steam Market, the original price is as important as the discounts - There are a lot of different sales, and there are always some games with discounts in the platform. The discounts range between -10% to -100% (free).
It would be nice to check the discount strategy at a sale and see how it influences sales. Some developers opt to never discount their games (See Factorio, Rimworld) while others discount it frequently. Discounting a game causes that in the future, sales with discounts less than the best discount availaible will be seen as not a good deal, and of course buying the game at full price will not be a good deal either. There is a great webpage dedicated to storing the discounts for each game: https://isthereanydeal.com/ .
In any case, the original pricing strategy is also very important, and the starting point for any game, which will offer normally a -10% discount at release.
First we will need to check how many free to play games there are. It will be interesting to do this by tags, as there will be big differences between them.
This is the percentage of free to play games on steam for games with more than 50 reviews: 16.696108856529005 %
Curiously the top-level genre with less free to play games is puzzle (around 10%). All the others are similar to the 16.69%. If we check the genres or subgenres, the top free to play games are genres associated to big multiplayer (MMO, MOBA, Battle Royale...).
Checking the features category this is confirmed: Multiplayer games are around 30% free to play while Singleplayer games are only 13% free to play. And Massive Multiplayer goes up to 65%.
There are a few exceptions outside the multiplayer genres, noted the Puzzle genre being usually priced, Idler/Clicker games with a lot of F2P (which could be expected) and curiously the Well-Written Tag (30%). This last one is interesting because visual novels are right in the middle, around 16% of F2P games.
Metroidvania and roguelikes/roguelites are also usually not free to play, with less than 8% of F2P games.
We also have the gambling and trading card games with more than 50% of F2P games.
Doing the Exploratory analysis we saw some outliers at more than 100€. These high prices are a niche for very specific VR games. We will limit the plots to avoid them.
Let's plot first one plot with all the games inside. We are going to only observe games with at least 50 reviews. We are also going to ignore free games (0.0 price) as we have already checked that distribution.
In this first plot, we have simply plotted the histogram by count. We can see that there are big differences in pricing if the game has more than 500 reviews or if it has only a few (50-500).
For the segment of viable games (50-500), the most popular price range is less than 5 euros, and the number of games decreases with each price segment.
If we look at really successful games (500+) the situation is different, here all the price segments below 20€ are similarly popular, 25 and 30 euros are quite less frequent (3 times less) and then there are only a few games with 35€.
There are a significant amount of games at the 35-40, 45-50 and 55-60 ranges. The rest are outliers.
It is very interesting to look at the same data but filtering by tags. In this case we will represent the percentage of games inside the number of reviews category to mantain similarly sized axis. This means that if we see 50% of cat_reviews 50-500 in the segment 0.1-5 €, half of the games with that tag and number of reviews were priced that way.
This has been interesting as the differences between tags are quite big.
Cheaper genres or tags are casual, arcade, incremental, idle games.
Strategy, rpg's and 3rd person games / FPS are the ones with pricier distributions.
It was interesting to check that while 97% of 2D games are less than 25€, for 3D it is only the 85%. So whatever genre you might want to explore, keep in mind that - people will find difficult to pay more than 25€ for a 2d game. It also reflects that AA studios do not usually target 2D games anymore.
You might note there are games tagged as free to play that have price - These conserve the F2P tag since at some point they were free, but now have a release price.
I wanted to check how many games have many languages available, also for voice, and how that might have affected sales. It will be hard and at most we will only see a correlation, but it might be interesting.
Since translations are costly, we will focus on the subset of games that at least got 500 reviews. But it might be interesting to check first if there are differences in the range between 50 and 500 reviews.
First let's get a bit of context. Which are the most spoken languages in the world?
Since we have popular languages in poor countries the list may not help us much. The most objective way would be comparing the market size for videogames for each country and which languages are spoken there.
Let's see at least this image from LAI Global Game Services for Western Europe:

We also have sources from ISFE: https://www.isfe.eu/games-sales-data/ , however they are not publicly available.
However this might be the one of the best sources for what we are looking for, Steam itself. https://store.steampowered.com/hwsurvey/Steam-Hardware-Software-Survey-Welcome-to-Steam . Note that the data is from May hardware Software Survey 2022.
Let's plot first in a nice graph bar the percentages from the Steam Hardware Survey we saw before, to better put into context the next plots.
Now we are going to plot the number of games with each language, first text only and then voice.
Let's try summarizing these 3 plots into one.
Before trying to analyze this data, last thing to consider - from the games we've been grouping the data from all years, but for the users data we've only considered very recent data. This is still an interesting comparison as the whole Steam catalog is available, so if any language is trending, games that have it available might have an easier time performing sales.
China being a big user of Steam (in example) is a recent factor and a good example, in spite of some caveats which we will discuss later.
Let's consider what the data tells us about 2021, and since we are getting only a recent year, let's exclude early access games as well (as it is typical that additional languages are added later, prior to release).
My initial thought when reviewing this data was that Spanish (my native language) may be undertranslated and specially underdubbed.
However, as the first sources of data I put before suggest (and in opposition to the steam survey itself) the market size in Spain is much smaller than Germany or France, so it makes sense to priorize these markets.
I found another source which should have a strong correlation to games sold in Steam, download traffic from Steam: https://store.steampowered.com/stats/content/

It's a map of global traffic from Steam to the different regions. I will not bother scraping it, but instead I will get the data by hand if the percentage is greater than 0.1 . Bear in mind this might change in different dates, holidays may specially affect it. But it uses the whole last week data so weekends are included.
Note that I've only represented countries that had more than 0.5% of the global traffic on Steam. The issue here to compare them directly with the information above is that there are languages that are used in more than one country. In fact, Spanish is splitted between Spanish - Latin America and Spanish - Spain, and Portuguese also has Portuguese - Brazil. But Asian countries tend to have understanding or coofficially Chinese, many Latin American countries have Spanish as first language, whilst French is spoken in some old colony states. In Central Europe, it is also typical to use German Or French.
So it is a bit hard to do a correlation to check if publishers/developers are thinking correctly of the languages in which to translate their games. At a first glance, in general, it looks like they are driven by sales, not users and possibly some outside market studies that tells them this information.
In fact, it is possible that more accurate data is accessible via the Steam Partner program (i.e which percentage of sales have you made in each country in Steam, if you have already released a game).
I am going to discuss primarly text data (menus/subtitles), as it is more or less correlated with voice acting (about half of the games recently get voice acting).
The most glaring contradiction is that China is the country with the bigger traffic, but looking at the full aggregate the language is only the fifth (in written) and seventh (in voice). This may be due to several factors: Game developing is still done from the western world and translating to Chinese/Japanese is harder, but specially that China rise in using Steam / PC gaming is a recent factor. See this article for more information: https://www.pcgamer.com/its-time-to-pay-attention-to-china-inside-the-worlds-largest-pc-games-industry/.
Another strange treatment is Russian, which should be a little more translated. South Korean (which has a solid PC tradition) and Portuguese vs Italian are also imbalanced. There is a bigger market in South Korea or Brazil/Portugal than Italy, however, there are almost twice the games translated to Italian than South Korean/Portuguese. This might have to do with the western development traditions, but it seems a good opportunity as well. Turkish is also largely forgotten in spite of its size in userbase and activity.
Looking at last years some of the trends in user activity are actually much more correlated.
In general, newer games seem to have more translations available. But not all languages have increased - European languages have remained at similar numbers or even with a small decrease. The Asian languages and Russian are the ones that have increased by a large margin.
Chinese moves to a solid second position. Comparing 2021 to the full release data, Chinese (simplified) moves from 32% to 50%. If we compare 2014 to 2021, it moves from 10% to 50%. Russia moves from 29% in 2014 to 38% in 2021. Japanese goes from 14% to 37%, and Korean from 8.7% to 26.5%.
Something that may have helped Japanese and Korean is that now console ports to PC are almost inevitable. In the past decade, specially at the beginning, it was not as common as it is now, and these are countries with very big videogame markets which have a lot of console releases translated.
Japanese is notable as well as it is the 3rd most dubbed language, although it is not the 3rd more translated in general. It may have to do that the video game industry there is very strong, so a lot of games actually come from there and are already translated and dubbed.
Lastly, Turkish has gone from 3.7% to 13.5%. In general all minor languages have increased.
One possible issue of translating the game to Chinese is that there are concerns about a Steam ban on China. See this article for more information: https://www.rockpapershotgun.com/steam-troubles-in-china-raise-concerns-that-a-ban-is-coming . The key getaway is that Steam is operating in a grey area, but China regulates heavily (and censors) the video game industry. However, it is a good opportunity.
In any case, real market data would be more interesting and accurate. What are the kind of games played on South Korea on Steam? What genres do they prefer? All countries do not have the same preferences. We could infer that from the languages supported, but at the end that's what the publishers decided, not the real data.
One of the things I was more interested in explore was studying the legacy / impact of big titles that defined or even invented a genre. With that objective, I am going to focus on few sub-genres, highlighting those very influential games.
Can we check if influential games drive future development / sales in the same genre?
Remember this data is only for games on Steam - There might be mentions to games from competitors but the data is not included in the values shown in the plots.
Soulslike
This is a really clear example. Demon Souls "invented" the subgenre soulslike, but the Dark Souls cemented it. In the first plot we can see a few games started appearing at the same time as Dark Souls 2, following the success of Dark Souls.
After Dark Souls 3 however, is when the genre is firmly stablished - two years after it released, more than 1.5% of mages released on Steam are Souls-like, and they get a decent amount of reviews.
There are pure souls-like games (Bound by Flame, Lords of the Fallen are the first "clones") but later also a lot of games such as Hollow Knight, Jedi Fallen Order, Dead Cells that are inspired by some of its mechanics.
Note that 2022 is a bit skewed since we only got the first quarter and Elden Ring is included. Probably by the time 2022 finished the % might vary.
Metroidvanias
In this example it is a bit harder to see any kind of trend. The beginning of 2010 was a hard place for the metroidvanias. However, in 2013 there is a resurgence: This could be linked to being more easier to publish on Steam, and a lot of indie studios decided to do some Metroidvania games since the official sagas (Metroid and Castlevania) were not publishing any good/new games. In any case, around 2013 is when we get a lot (at least by percentage of games released) Metroidvanias.
There are no really influential games during those years however. In fact we see the quantity of games decrease after 2013. In 2015/2016, Ori and the blind forest and its definitive edition come, and a year later the hit Hollow Knight appears, which is to date and by far the most popular Metroidvania game released on PC.
After that, the % of metroidvania games being released start to rise slightly (from 1.5% to 2.5%).
Battle Royales
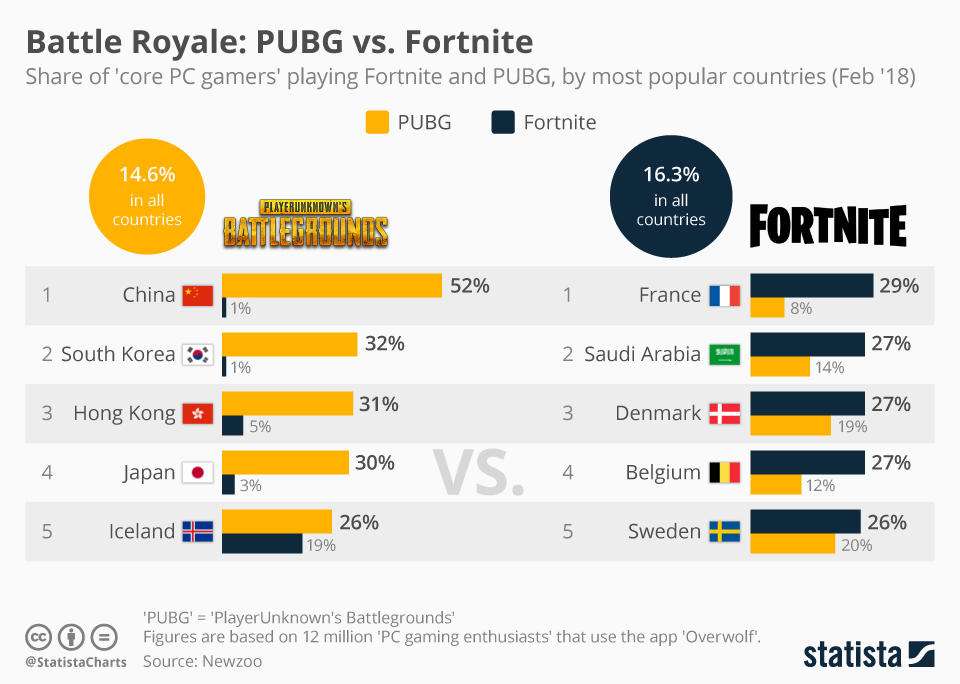
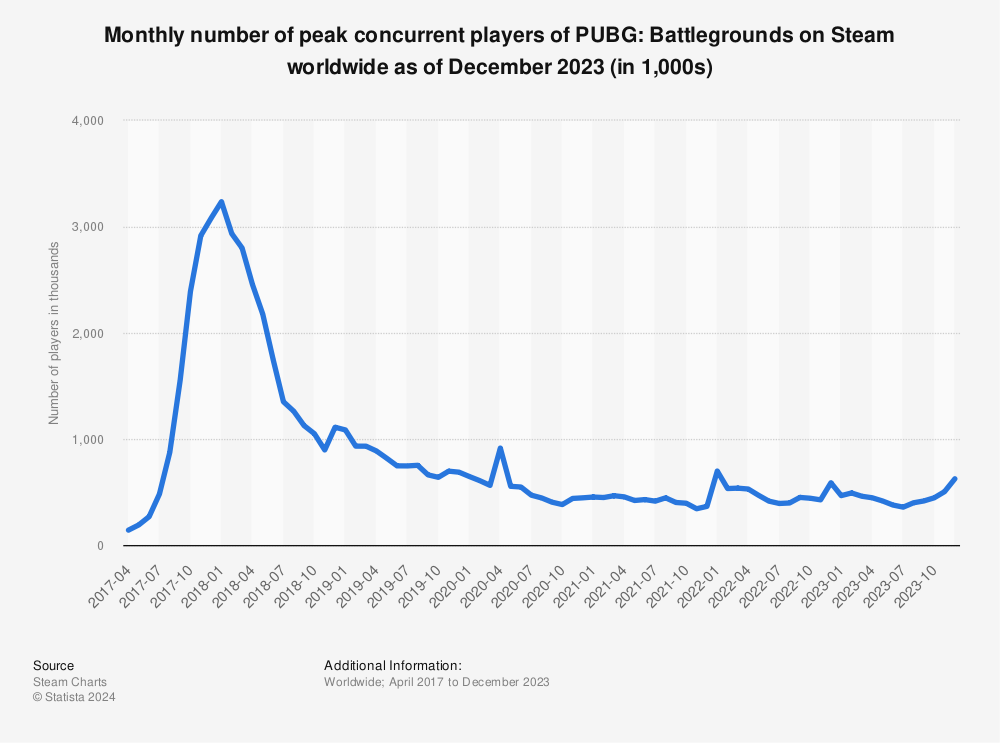
Another good example of influential games and a genre being created. Even if we got some older games with the Battle Royale tag, the genre was invented/exploted when PUBG was released on early access (March 2017). Note that the date in the first plot is when it went out of early access into full release, by the end of the year.
Epic saw the opportunity and made a Battle Royale mode into an early access with initially Coop focus, Fortnite (in September 2017). And it also took the world by storm. You can check the some stats below from Statista for both games.
Certainly at the end Fortnite was the more popular game (as it kept its huge user activity at least by 2020), and it allowed Epic to break bank (and user), and open what is now the 2nd biggest digital pc games store.
In any case, it was clear that this new competitive PVP genre was very atractive for big publishers. A lot of companies tried to rush into the genre. Perhaps the 3rd most popular game is Apex Legends, which was released in 2020. Apart from that, no game has come close to the two initial competitors / founders of the genre.
 You will find more infographics at Statista
Find more statistics at Statista

Find more statistics at Statista
MOBAs
On 2009 League of Legends was released and quickly began rising on popularity. To this date it still can be considered the king of MOBAs.
Actually the genre was invented back in 2003, when Dota, a mod based on Warcraft 3 was released. Although popular in some communities, it was not really a hit. However, some years later, LoL changed that and the genre exploded.
After 2009 a lot of games tried to follow the LoL success in PC. An early successful game (that did its own take in the genre by going platformer) was Awesomenauts. But in 2013 Valve made a move and recruited the creator of the original mod and made an official sequel. This was a bit tricky since the original game was a mod based on a game from a competitor (Activision Blizzard), but they simply changed the name of the heroes and moved away in style (but not mechanics) from the original mod.
This game was a huge success and it is now still one of the most played games on Steam. After that, some games are being still released but none have gained the number of users that LoL or Dota 2 has. The only important exceptions might be Smite or Paladins, but they do not come close to the numbers that again those two big games had (and still have).
We are going to do a similar analysis to the Influential Games section from before. In this case, we will add the release date of major VR games and also VR headsets.
A reminder about what the columns regarding VR mean. They have been scrapped from the Steam Webpage itself:
vr_supported: boolean, if True then the game has VR compatibility. The exact headsets or controllers are not considered. It is not a game that can be only played in VR.
vr_only: boolean, in this case the game can ONLY be played in VR, it has no normal PC mode.
vr_pcinput: In this case we got the notice under VR Support. We are interested in getting if the game has to be played with mouse and keyboard or controller, meaning there are no touch controllers.
It is important to remember that we are only showing data for games on Steam, although in this case I will also highlight VR headsets from competitors, even PS VR which is not compatible for PC.
As we can see, the release of HTC Vive and PSVR (that cannot be used in PC, but a lot of games from Playstation were ported to PC) was the kick-off of VR releases in PC.
In the first years there was a kind of fever to release VR games (even though there were not much users with headsets). Older games released VR modes, which is why Payday 2 and Warthunder are some of the "biggest" VR titles.
We've separated VR only and VR supported games for this reason - lots of games decided to add a VR mode between 2016 and 2020. But they are primarily non VR games. Some exceptions might be VRChat (primarily VR), and to a minor extent MS flight Simulator, No Man's Sky, SW Squadrons, Elite Dangerous which are spaceship/aircraft games were VR modes are really popular.
However for the success of the VR genre it is better to check the VR only category. As we can see, each year from 2016 less percentage of games are being developed purely for VR. In terms of total reviews (which in general rise each year) it is more or less stable. 2019/2020 are two of the best years, with the releases of Beat Saber, Boneworks and HL:Alyx.
It was thought that the release of HL Alyx might influence other developers to put major VR releases, but as we see the trend is not favourable - 2021 has seen no major releases, even though Oculus Quest 2 was released in 2020 bringing more potential users to the table.
In PC this genre is definetly in decline but with no signs of dying, but it is possible that through the Oculus standalone store and headset it continues to rise if slightly. Check this plot from roadvr https://www.roadtovr.com/oculus-quest-store-revenue-1-billion-milestone-growth-meta/:

Steam Deck is a portable PC made directly from Valve (the company that owns Steam). This data comes from 19th April 2022, and Steam Deck was released in 25th February 2022. So it is probably outdated by now - a large effort was being done to check compability at the beginning of the launch, but a lot of games remain with unknown compatibility. Lots of games were adding patches to have better compatibility during those dates.
We can certainly see that games with higher ratings are the ones that tend to have better compatibility and also at least having been checked (not unknown compatibility). However if we check by number of reviews, it is true that games with low number of reviews are not being verified, but from 3000 number of reviews there is no clear link between compatibility and number of reviews.
For the reasons above (it was a very early state of the Steam Deck Launch) I have decided not to dig deeper into the data. It could have been interesting to check things by genre, for instance.
Checking by years, where we had only releases from selected big publishers (before 2013) the compatibility hovers around 20% and many games had been tested. Then recent years tend to have more compatibility and having been tested, which is normal.
It is true that newer games that use a lot of resources may not be playable and older games which use less resources can be run, but The Steam Deck is capable of running a lot of resource intensive games, which is why we do not see a real decline for games in 2021/2022 in terms of compatibility.
This puts and end to the conclusions. If you want to dig deeper into the data, check the kaggle datasets to do your own notebooks - Or check my exploratory data analysis that has additional plots.

 Source: